GPU Analytics Application
1. Overview
OnStak is a trusted Cisco and Splunk Partner verse Build partner, offering the GPU Analytics Application. It is a powerful tool designed to leverage the computational power of Graphics Processing Units (GPUs) for a wide range of high-performance computing tasks. It is built to accelerate workloads such as deep learning, scientific simulations, and data analytics by efficiently managing GPU resources and optimizing execution processes.
This application provides an intuitive interface for configuring GPU resources, monitoring their utilization, and executing workloads with minimal overhead. It integrates seamlessly into existing development pipelines and supports major framework detections like TensorFlow, PyTorch etc., ensuring compatibility with modern machine learning and data processing ecosystems.
1.1 Use Cases
GPU Application is ideal for developers, data scientists, and researchers seeking to maximize the performance of GPU resources in both standalone and distributed computing environments are as follows
a) GPU Resource Utilization Monitoring
Identifying Bottlenecks: Monitor GPU utilization to detect underuse, memory constraints, or thermal throttling for performance optimization.
Load Balancing: Ensure even workload distribution across GPUs in multi-GPU setups to maximize efficiency.
b) Process Performance Analysis
Execution Time Analysis: Track GPU execution times for processes to identify and optimize slow-performing tasks.
Resource Demand
Resource Demand Evaluation: Analyze GPU resource usage per process to ensure efficient allocation and scaling.
c) Fault Detection and Preventive Maintenance
Anomaly Detection: Identify irregular GPU performance metrics, such as temperature spikes or memory leaks, to predict potential failures.
Proactive Maintenance: Monitor GPU health indicators to schedule maintenance before critical issues arise, minimizing downtime.
d) Energy Efficiency and Cost Optimization
Power Usage Analysis: Monitor GPU power consumption to identify and optimize energy-intensive processes.
Cost-Effective Scaling: Evaluate GPU utilization to minimize overprovisioning and reduce operational costs.
e) Enterprise GPU Management and Forecasting
Centralized Resource Management: Monitor and manage GPU resources across the enterprise to ensure optimal allocation and utilization.
Capacity Planning: Analyze historical GPU usage trends to forecast future demand and plan infrastructure scaling effectively.
f) Real-Time Anomaly Detection and Alerts
Immediate Threat Detection: Identify abnormal GPU behavior, such as sudden usage spikes, in real-time to prevent potential failures.
Automated Alerts: Trigger instant notifications for anomalies to enable rapid response and minimize downtime.
1.2 Benefits
Unified Monitoring
Provides a centralized dashboard for real-time insights into GPU performance, machine health, and job status, enabling easier management.
Actionable Insights
Drill-down features offer detailed analytics, allowing users to quickly identify inefficiencies and optimize GPU resources for improved performance.
Proactive Management
Helps prevent potential failures by tracking GPU and job metrics, ensuring continuous, reliable operation and minimizing downtime.
Scalable for Growth
Supports large-scale environments, making it suitable for enterprises with expanding GPU infrastructure and resource demands.
Cost Efficiency
Optimizes GPU usage and job performance, reducing resource wastage and lowering operational costs.
2. How it Works Overview (Collects Data)
The GPU Analytics App is an app built for Splunk Enterprise platform, that provides IT GPU asset insights using various dashboards, which visualize the data in Splunk Metrics Index. Initially when the App is installed it will not have any data, and all the widgets will show empty values. For the App to work as intended, a mandatory component called gpu-mon-cli (GPU Monitoring Client) is to be installed on the host machine with GPU.
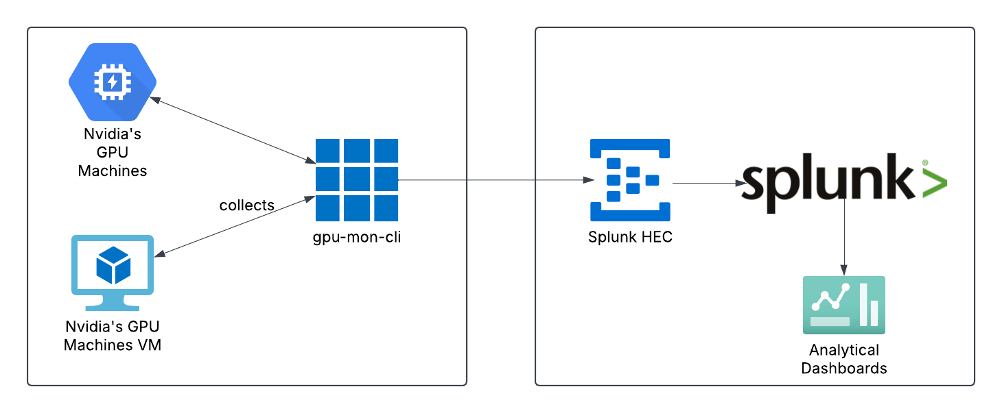
2.1 Overview: gpu-mon-cli
gpu-mon-cli is a client application designed to collect comprehensive data from a GPU-enabled host. It must be deployed externally to the Splunk platform and run on a machine with a GPU. The application is responsible for gathering GPU performance insights and ingesting this data into a Splunk index using an HEC token. Without gpu-mon-cli, the application will not function, and no data will be available for visualization within Splunk.
2.2 Supported Nvidia GPU’s
- Full Support
- NVIDIA Tesla Line:
- A100, A40, A30, A16, A10
- H100
- T4
- V100
- P100, P40, P4, P6
- M60, M40, M6, M4
- K80, K520
- NVIDIA Quadro Line:
- RTX 8000, RTX 6000, RTX 5000, RTX 4000, RTX 3000
- GV100, GP100, P6000, P5200, P5000, P4000, P2200, P2000, P1000, P620, P600, P400
- M6000 24GB, M6000, M5000, M4000, M2000
- K6000, K5200, K5000, K4000, K4200, K2200, K2000, K2000D, K1200, K620, K600, K420, 410
- NVIDIA GeForce Line:
- none
- Limited Support
- NVIDIA Tesla Line: All other current and previous generation Tesla-branded parts
- NVIDIA Quadro Line: All other current and previous generation Quadro-branded parts
- NVIDIA GeForce Line: All current and previous generation GeForce-branded parts
- NVIDIA Tesla Line:
3. Prerequisites
- Splunk Enterprise v9.x or above
- One Machine with GPU-MON-CLI Installed
- vCPU: 8
- vMem: 32 GB
- Disk: 250 GB (Thin Provisioned)
4. Getting Started
Following high-level steps need to be followed to get started with GPU Analytics App for Splunk. The following sections provide detailed instructions for performing each of these steps.
- Splunk: Install the App
- Splunk: Configure HEC for Data Ingestion (save HEC token)
- Splunk: Create Macro in Splunk (For Search)
- Splunk: Create a user with Admin Role
- gpu-mon-cli: Install, configure & run the gpu-mon-cl
- Splunk: Explore the App Dashboards for Insights
4.1 Splunk: Install the App
In Splunk, there are two ways to install the App
4.1.1 Browse and Install from Splunkbase
1. Click on the "Apps" menu from the top bar of the Splunk dashboard.
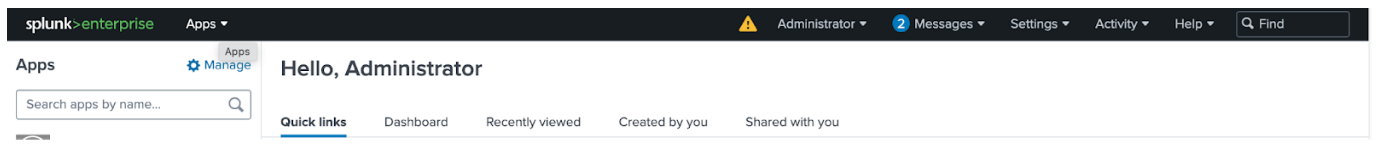
2. Select "Find More Apps" to search for apps from Splunkbase

3. In the "Browse More Apps" page, you can search for "GPU Performance Analytics" and will show the App.
4. Once you locate the app, click the "Install" button next to the app.
4.1.2 Download App File and Install from File
1. You can download the “tar.gz” app file on your local system from the link
2. Install the app by Navigating to the "Apps" menu and selecting "Manage Apps".

3. On the Apps page select "Install app from file".
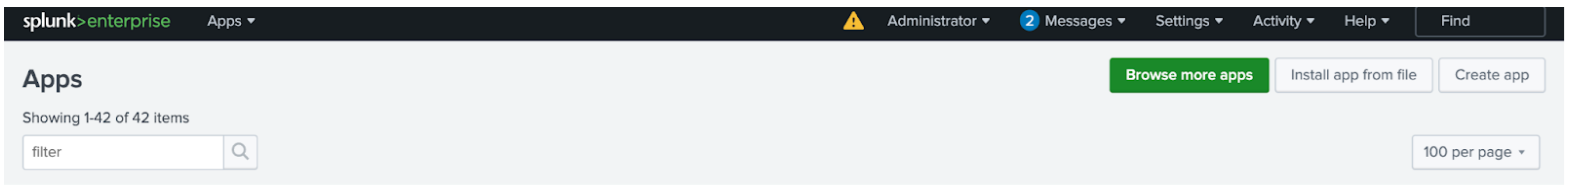
4. On the "Upload App" page, click "Choose File" to upload the app file from your local machine.
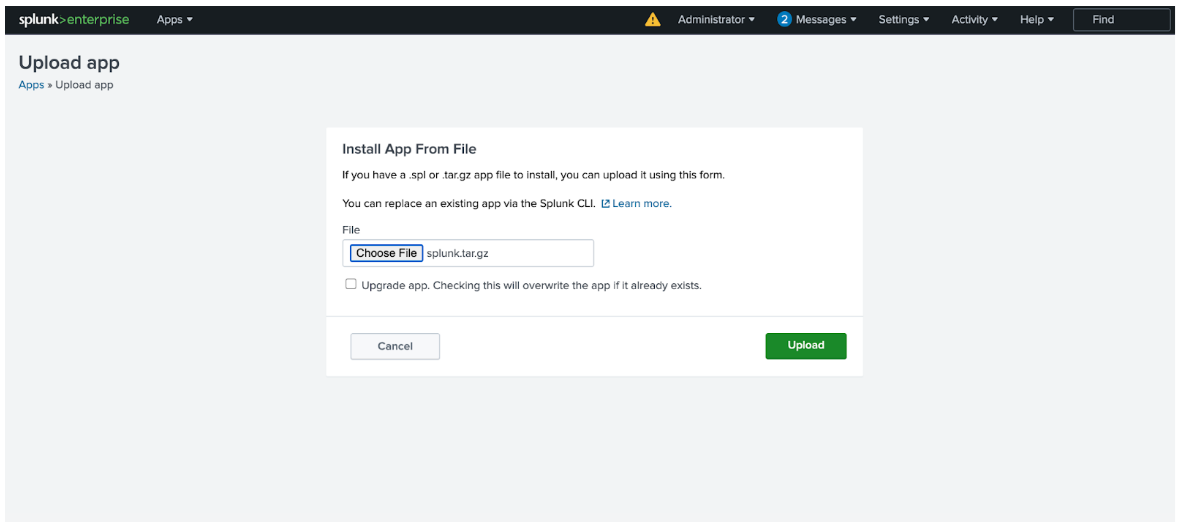
5. After selecting the file, click "Upload" to install the app. You also have the option to upgrade an existing app by checking the upgrade box.
4.2 Splunk: Configure HEC for Data Ingestion
For HEC Configuration in Splunk, please refer to the following Configure HEC on Splunk Enterprise for detailed instructions
4.2.1 Create a Metrics Index on Splunk Enterprise
4.2.1.1 Prerequisites
- Ensure you have administrative privileges in your Splunk instance.
- Confirm that your Splunk environment is up and running.
4.2.1.2 Log in to Splunk Web
- Open your browser and navigate to your Splunk Web interface
- Log in with your administrator credentials.
4.2.1.3 Access the Indexes Page
- Once logged in, navigate to Settings in the top-right corner of the page.
- Under the Data section, click Indexes.

4.2.1.4 Create a New Index
- On the Indexes page, click the New Index button in the top-right corner.
- Select the type of index you want to create:
a. Metrics: Used for time-series data.
b. Summary: Stores summarized data.
4.2.1.5 Configure the Index
- Enter the Index Name (e.g. gpu_pm_metrics). Make sure the name is unique.
- Set the Index Type -> Metrics
- Configure the following fields:
a. Timestamp Resolution: Set to Seconds
b. Home Path (Recommended): $SPLUNK_DB/{Index_Name}/db
c. Cold Path (Recommended):
$SPLUNK_DB/{Index_Name}/colddb
d. Thawed Path (Recommended):
$SPLUNK_DB/{Index_Name}/thaweddb
e. Select Application:
Select App named “GPU Performance Analytics” Select Application:

Note: To use default, leave Home Path, Cold Path & Thawed Path blank (Recommended)
4.2.1.6 Save the Index
- Click the Save button to create the index.
- The new index will now appear in the list of indexes.
4.2.2 Enable HTTP Event Collector on Splunk Enterprise
Before a user can use Event Collector to receive events through HTTP, you must enable it. For Splunk Enterprise, enable HEC through the Global Settings dialog box.
1. Click Settings > Data Inputs

2. Click HTTP Event Collector

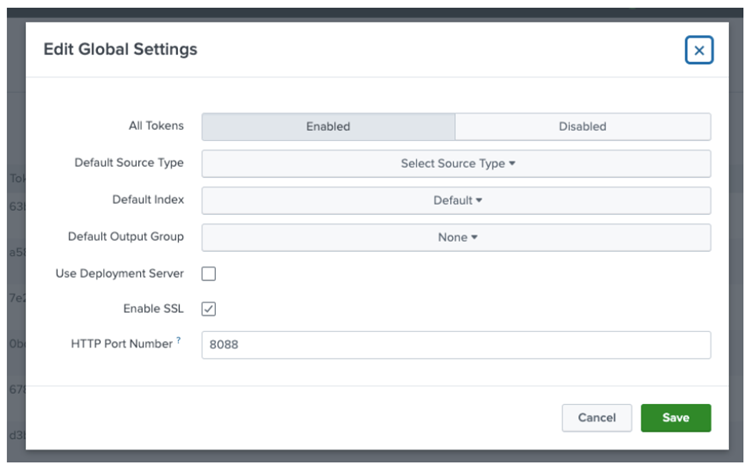
3. Click Global Settings

4. In the All-Tokens toggle button, select Enabled.
- Choose a Default Source Type for all HEC tokens. You can also type in the name of the source type in the text field above the drop-down list box before choosing the source type.
- Choose a Default Index for all HEC tokens.
- Choose a Default Output Group for all HEC tokens.
- To use a deployment server to handle configurations for HEC tokens, click the Use Deployment Server check box.
- To have HEC listen and communicate over HTTPS rather than HTTP, click the Enable SSL checkbox.
- Enter a number in the HTTP Port Number field for HEC to listen on.
- Confirm that no firewall blocks the port number that you specified in the “HTTP Port Number” field, either on the clients or the Splunk instance that hosts HEC.
- Enable SSL: Should be marked only if splunk instance is HTTPS enabled, otherwise please uncheck it

5. Click Save
4.2.3 Create an Event Collector Token on Splunk Enterprise
To use HEC, you must configure at least one token.
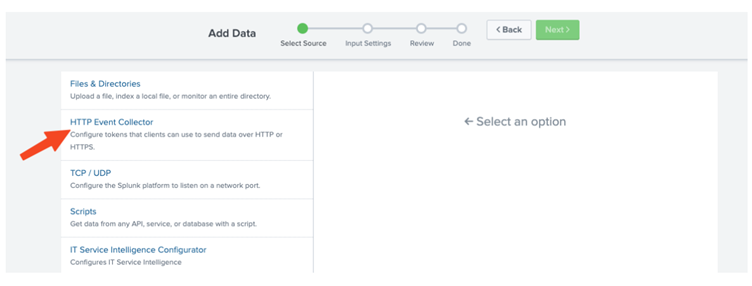
1. Click Settings --> Add Data.
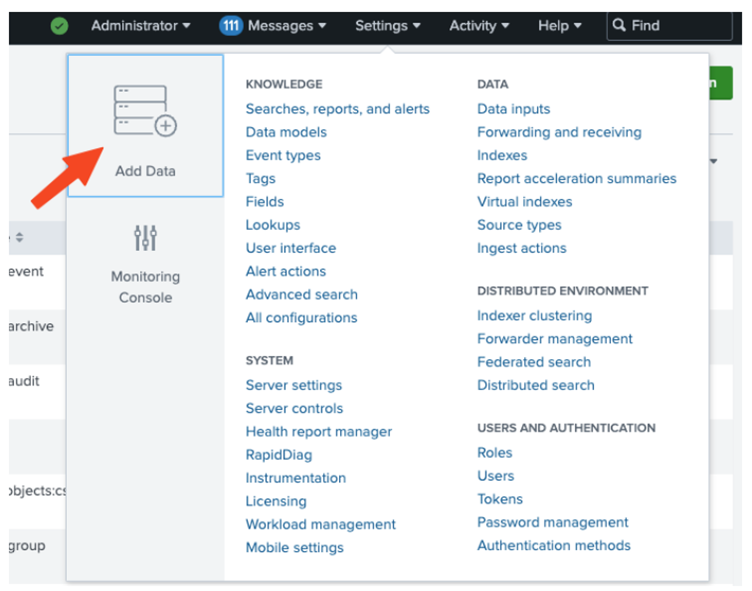
2. Click Monitor

3. Click HTTP Event Collector.
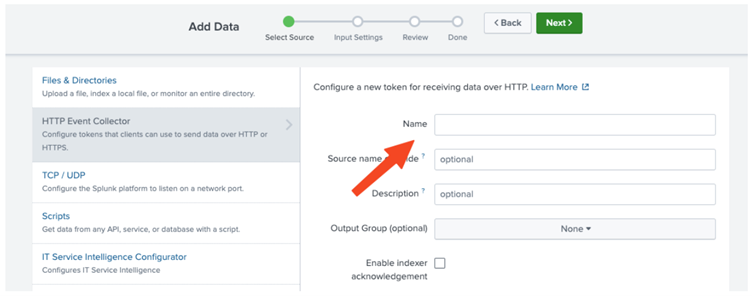
4. In the Name field, enter a name for the token.
- In the Source name override field, enter a source name for events that this input generates. (Optional)
- In the Description field, enter a description for the input. (Optional)
- In the Output Group field, select an existing forwarder output group.
- If you want to enable indexer acknowledgment for this token, click the Enable indexer acknowledgment checkbox. (Optional)
- Click Next.
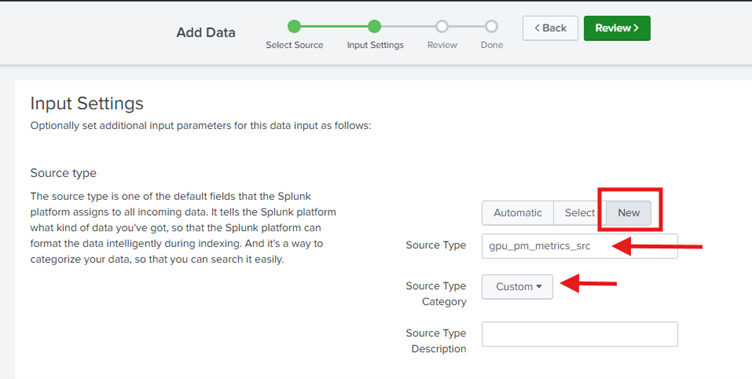
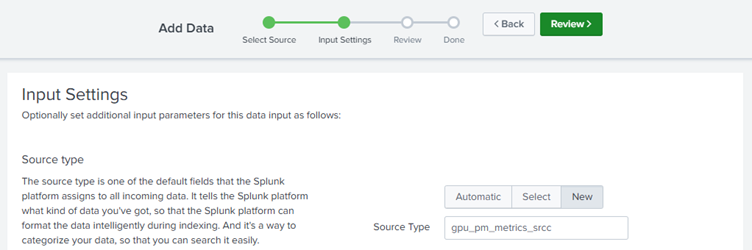
- Confirm the “Source Type” to be “gpu_pm_metrics_src”
Note: if you want to have a different source type, type in the source type name but then you would need to change it in the gpu-mon-cli configuration
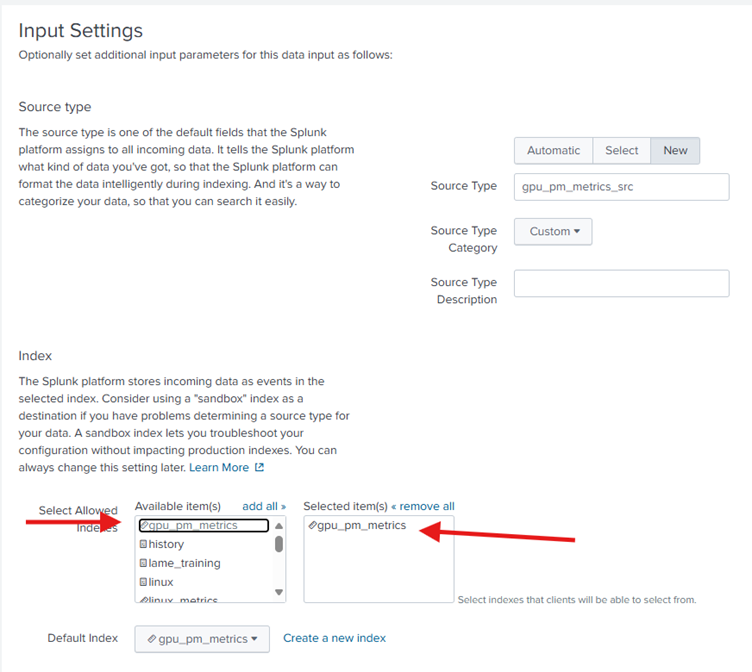
- Make sure to select “Metrics Index” (refer to section 4.2.1) in the selected items for HEC events.
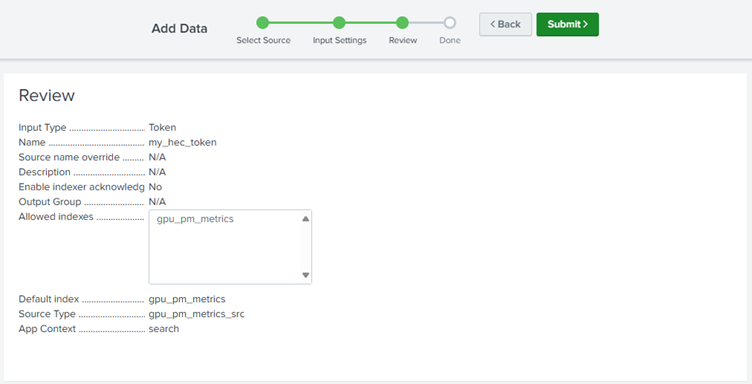
5. Click Review.
6. Confirm that all settings for the endpoint are what the user wants.
7. If all settings are what the user wants, click Submit. Otherwise, click < Back to make changes.
8. Once you submit it, you will be able to see following output
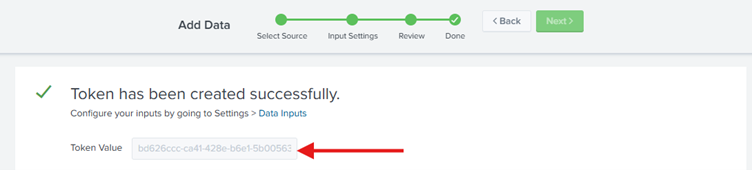
Note: Copy the token value that Splunk Web displays and paste it into another document for reference later.
For more information on Send data to HTTP Event Collector Click Here
4.3 Creating a Macro in Splunk
A Splunk macro is a reusable search expression that simplifies complex searches and promotes consistency across dashboards and reports. Follow these steps to create a macro in Splunk:
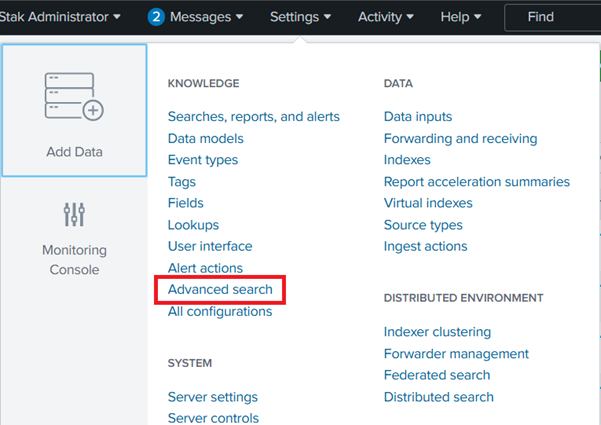
4.3.1 Navigate to the Macros Page
- Open Splunk Web and go to Settings.
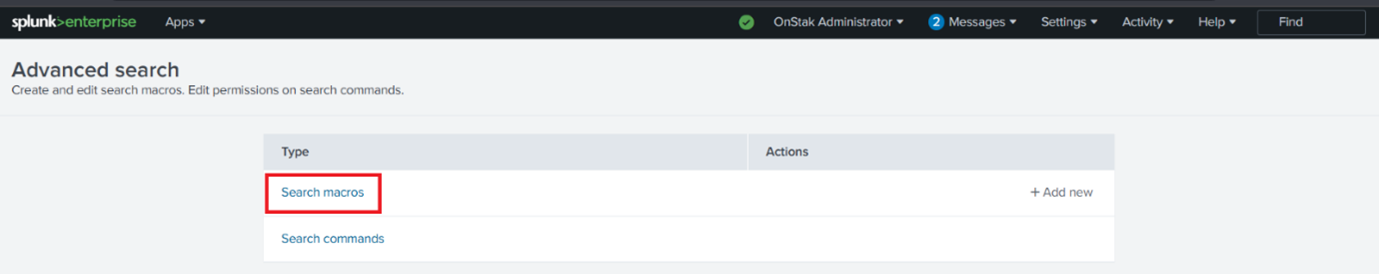
- Under the Knowledge section, select Advanced search.
- Click on Search macros.
- Choose New to create a new macro.
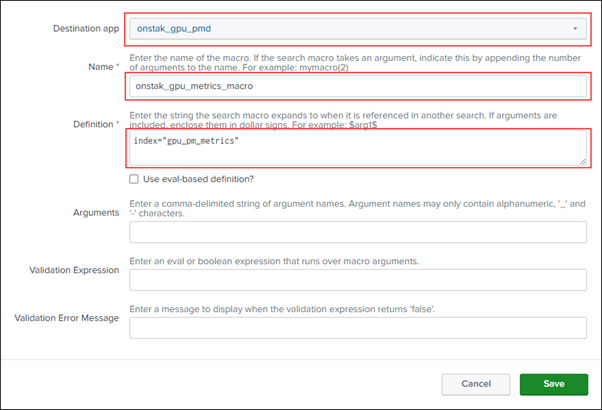
4.3.2 Define the Macro
- Name – A Unique name for the macro must be set onstak_gpu_metrics_macro
- Definition – Enter the search expression you want the macro to expand to. Example: index=gpu_pm_metrics
Note: Here in definition, you’ll need to write index name that you’ve created in the above section, if your index name is different, please use that one. - Arguments (Optional) – Define parameters to make the macro dynamic.
- Validation Expression (Optional) – Define constraints for input values.
4.3.3 Set Permissions
- Choose the App in which the macro will be available.
- Set Permissions:
a. Private – Available only to the creator.
b. Shared – Available to all users in the app.
4.3.4 Save and Use the Macro
- Click Save to create the macro.
- Use the macro in searches.
4.3.5 Editing or Deleting a Macro
- Navigate to Settings > Advanced search > Search macros.
- Locate the macro and click Edit to modify it.
- Click Delete if you want to remove it permanently.
Using macros in Splunk improves efficiency and maintains consistency in search queries across multiple dashboards and reports.
4.4 Create a User with Admin Role (Splunk)
To configure gpu-mon-cli, you first need to create a user with administrative privileges in Splunk Cloud. Follow these steps:
- Splunk User Management Page:
Splunk Cloud: Add and Edit Users - Create a New User:
a. Assign the Admin role to the user.
b. Ensure the user has the necessary permissions to manage data ingestion via HEC (HTTP Event Collector).
c. Ensure the user has necessary permissions to manage the kv lookups - Save the Credentials:
a. Store the newly created username and password securely.
b. These credentials will be required in a later step when configuring gpu–mon-cli using config_cli.
4.5 Install, Configure & run gpu-mon-cli
4.5.1 Overview
GPU Monitoring Client (gpu–mon-cli) is designed to efficiently manage data across multi-cloud and multi-site environments at scale. You can download the gpu–mon-cli latest version from here
The following files will be included in the download:
- config_cli
- run
4.5.2 System Requirements
1. Software Pre-requisites
- OS: Linux/Ubuntu
- Python: 3.8 or above
2. Hardware Architecture
- X86_64
For Linux/Ubuntu, please refer the following
4.5.3 gpu-mon-cli: Configure
The first step in running `gpu-mon-cli` is configuring it. To do this, open a terminal on your Linux system and execute the following command:
`sudo ./config_cli`
You will be able to see the following output
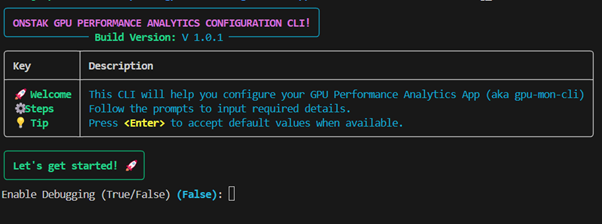
Tip: Press to accept the default values when available, they will be enclosed in the curly braces e.g. (False)
You will need to provide following information in order to configure the gpu-mon-cli app.
Recommendation: We highly recommend setting Enable Debugging & Enable Logs to True for debugging purposes
Enable Debugging: If sets True, it will show debug messages on the terminal/console, defaults to False
Enable CSV Dump: If sets True, it will dump the captured data in csv files, default is False
Enable Logs: If sets True, it will create log files for troubleshooting, default is False
Sampling Interval Seconds: Determines after how many seconds it captures the data from the Host GPU and send data to the Splunk, default is 60 seconds
Splunk HTTPS Enabled: Determines if the splunk instance is HTTPS enabled, if sets True it will use HTTPS
Splunk Host Address: Splunk host address, Public/Private IP address, default is 127.0.0.1 or localhost
Splunk Collector Port: Splunk HTTP Event Collector port (provide port with reference to the section 4.3.2.4), default is 8088
Splunk Management Port: Splunk Management Port (Settings > Server Settings > General Settings), default is 8089
Splunk Host App Owner: GPU Performance Monitoring App Owner, default is nobody
Splunk Host App Name: GPU Performance Application splunk name, default is onstak_gpu_pmd. Must use the default value
Splunk Host App Metrics Source Type: Provide the Application Metrics Source Type (provide with reference to the section 4.2.3.4), default is onstak_gpu_pmd
Splunk Metrics Token: Provide the Metrics Token (provide with reference to the section 4.2.3.8), no default value as this must be provided and it’s a sensitive information
Splunk Host App Username: Create a User with Admin Privileges and provide that username (provide with reference to the section 4.4), no default value as this must be provided and it’s a sensitive information
Splunk Host App Password: Reference to above step, provide the password (provide with reference to the section 4.4), no default value as this must be provided and it’s a sensitive information
Note: All the sensitive information will be stored in encrypted manner
Once all above information is provided in the config_cli, it will then test these configurations and saves only if everything is successful.
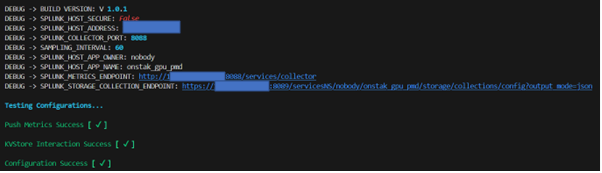
Otherwise, it will prompt a failure status as below

4.5.4 gpu-mon-cli: Run Overview
The gpu-mon-cli application, executed via the run, is designed to operate continuously on a GPU-enabled machine. It actively collects real-time GPU performance metrics, including utilization, temperature, memory usage, and power consumption. The gathered data is then securely transmitted to Splunk using the HTTP Event Collector (HEC) for visualization and analysis. Ensuring uninterrupted execution of gpu-mon-cli is essential for maintaining comprehensive GPU performance monitoring and analytics within the Splunk environment.
4.5.5 gpu-mon-cli: Running the Application
- Open a terminal on your GPU-enabled machine.
- Navigate to the directory where the gpu–mon-cli executable is located.
- Run the following command with superuser privileges to start the application:
`sudo ./run` - Once the App is running successfully, you must see following output on the terminal
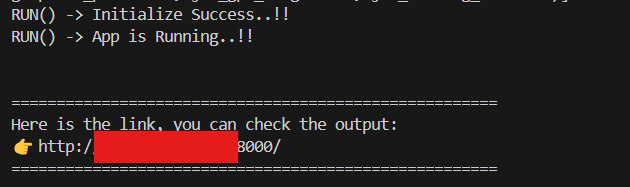
To ensure that the gpu-mon-cli application runs continuously and collects GPU performance data in real-time, it should be executed as a persistent background process. You can achieve this by running the application using a process manager like systemd
4.5.6 gpu-mon-cli: Background Process Using systemd (For Automatic Restarts)
- Create a new service file:
`sudo nano /etc/systemd/system/gpu-mon.service` - Add the following content:
[Unit]
Description=GPU-MON-CLI RUN SERVICE
After=network.target
[Service]
Type=simple
WorkingDirectory=/path/to/gpu–mon-cli
ExecStart=/usr/bin/sudo ./run_app
Restart=always
RestartSec=60
User=root
[Install]
WantedBy=multi-user.target - Reload systemd, enable and start the service:
`sudo systemctl daemon-reload`
`sudo systemctl enable gpu-mon`
`sudo systemctl start gpu-mon`
This setup ensures the gpu-mon-cli runs continuously and restarts automatically if it stops or if host experience a reboot.
4.6 Splunk: Explore the App Dashboards for Insights
To navigate to the GPU Performance Analytics app within Splunk, follow these steps:
- From the Splunk dashboard, click on the “Apps” dropdown menu at the top of the screen.
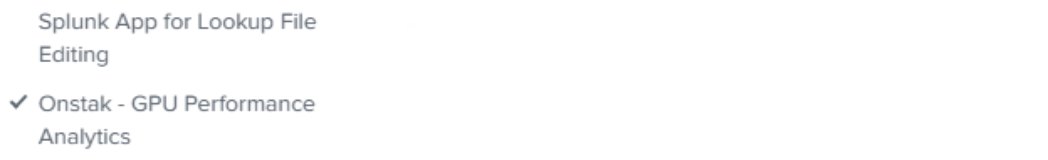
- Click on the dropdown to view a list of installed apps.
- In the list, you will see several apps available. Locate and select the “GPU Performance Analytics” app from the dropdown as shown in the image below.
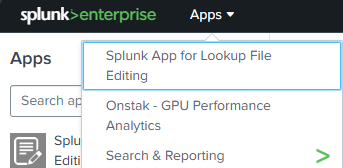
4. Once selected, the app will load, and open to the default HOSTS dashboard.
Once the GPU Performance Analytics app is open in Splunk, there are two main ways to navigate within the app.
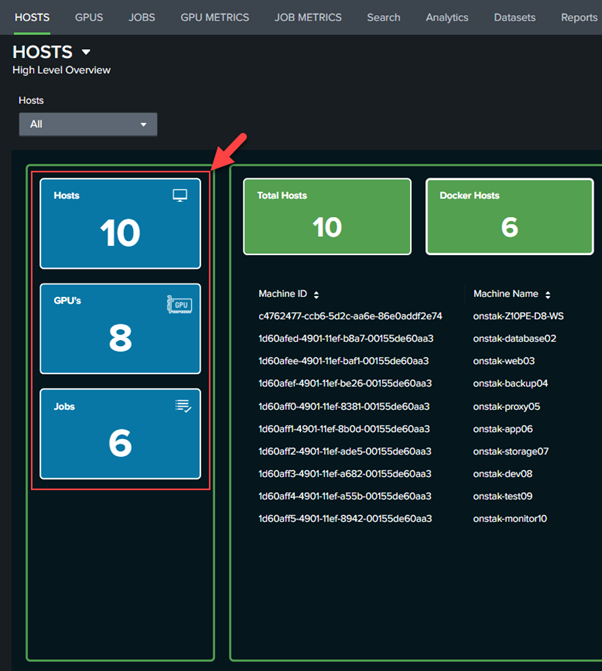
4.6.1 Navigate Using the Home Page Sidebar
You can click on the tiles in the Left Sidebar to navigate between the Overview Dashboards for Hosts, GPUs, and Jobs.
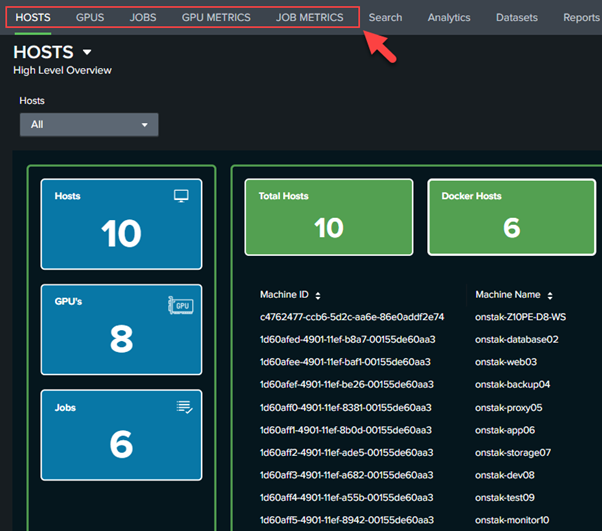
4.6.2 Navigate Using the Top Horizontal Menu
You can also navigate directly to any of the dashboards using the top horizontal menu options for Hosts, GPUs, Jobs, GPU Metrics, and Job Metrics.
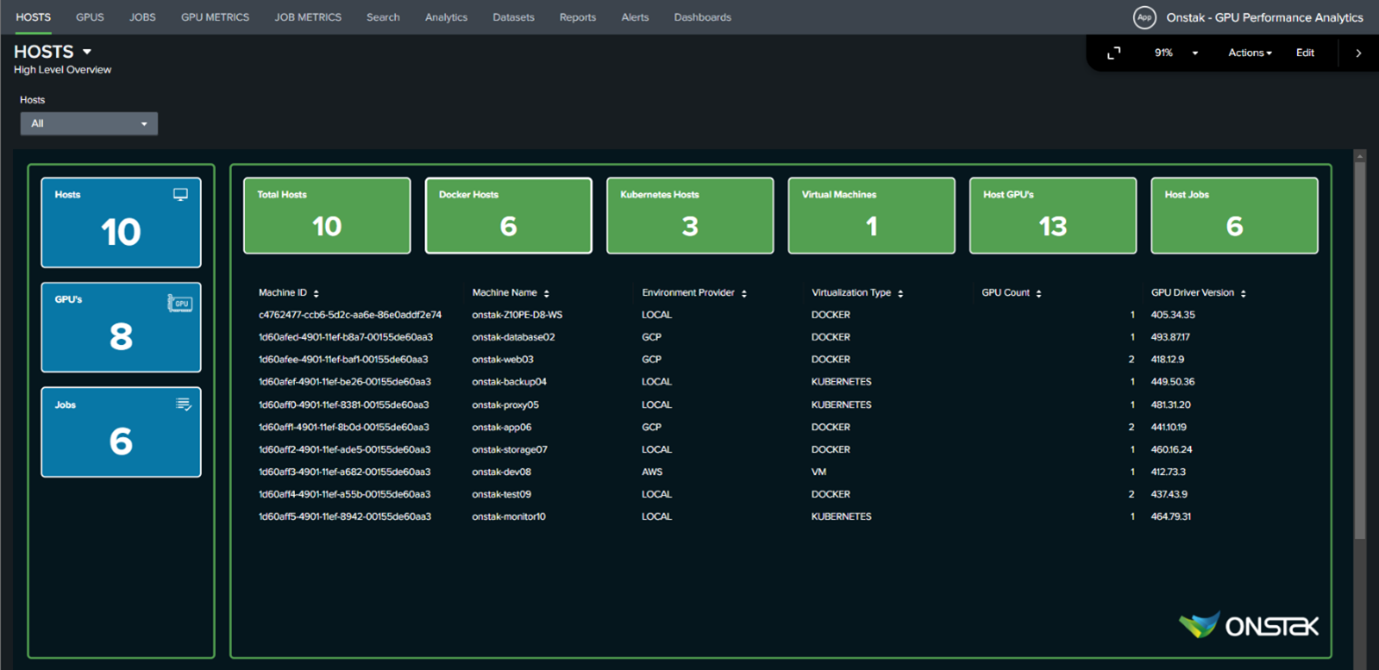
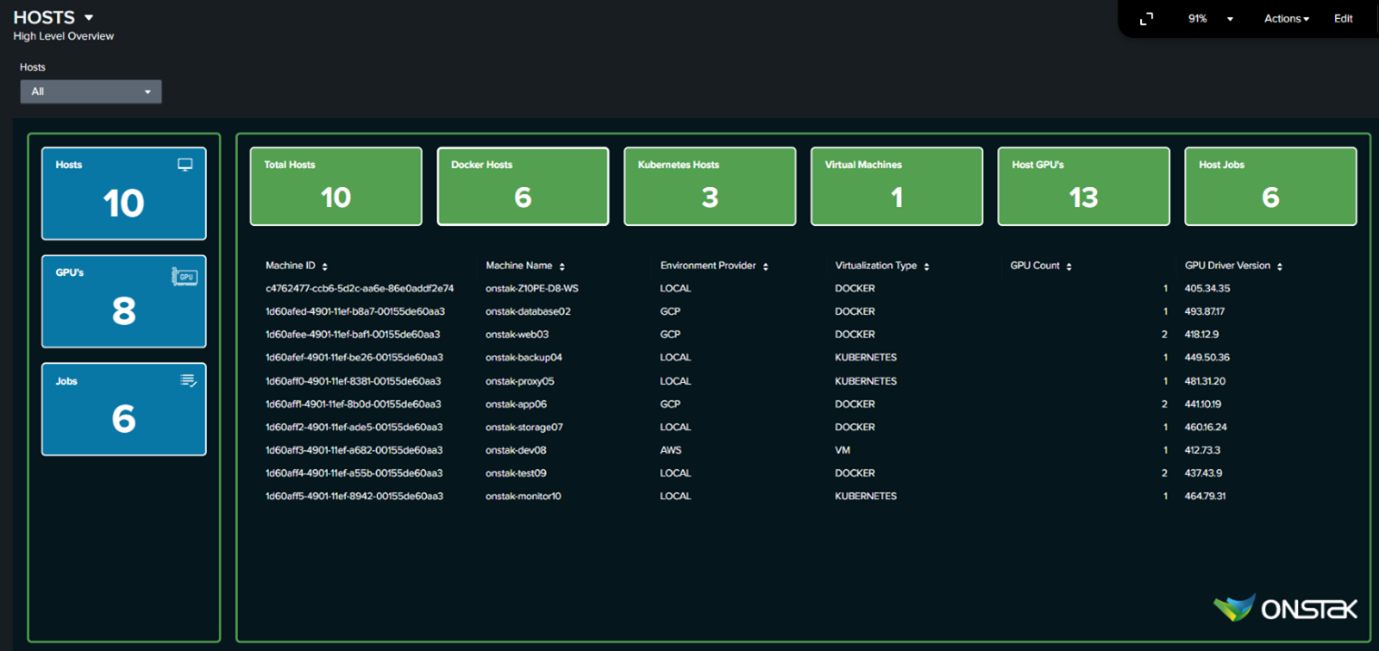
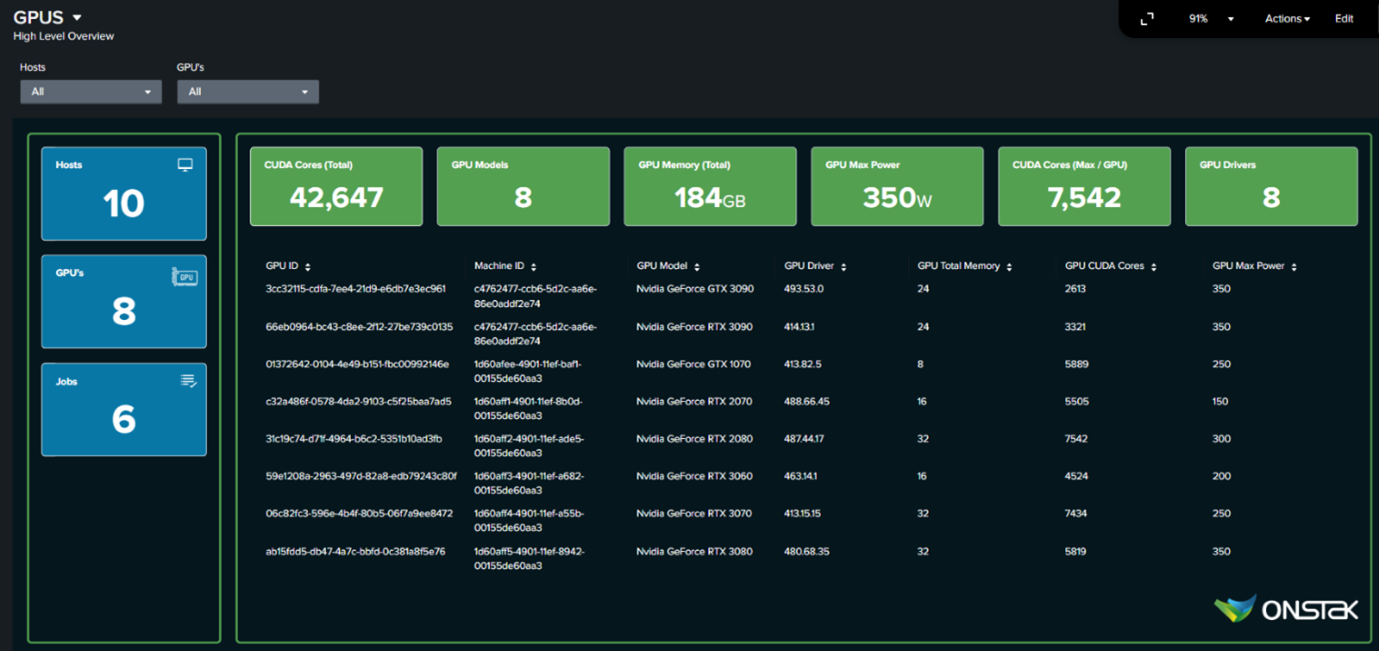
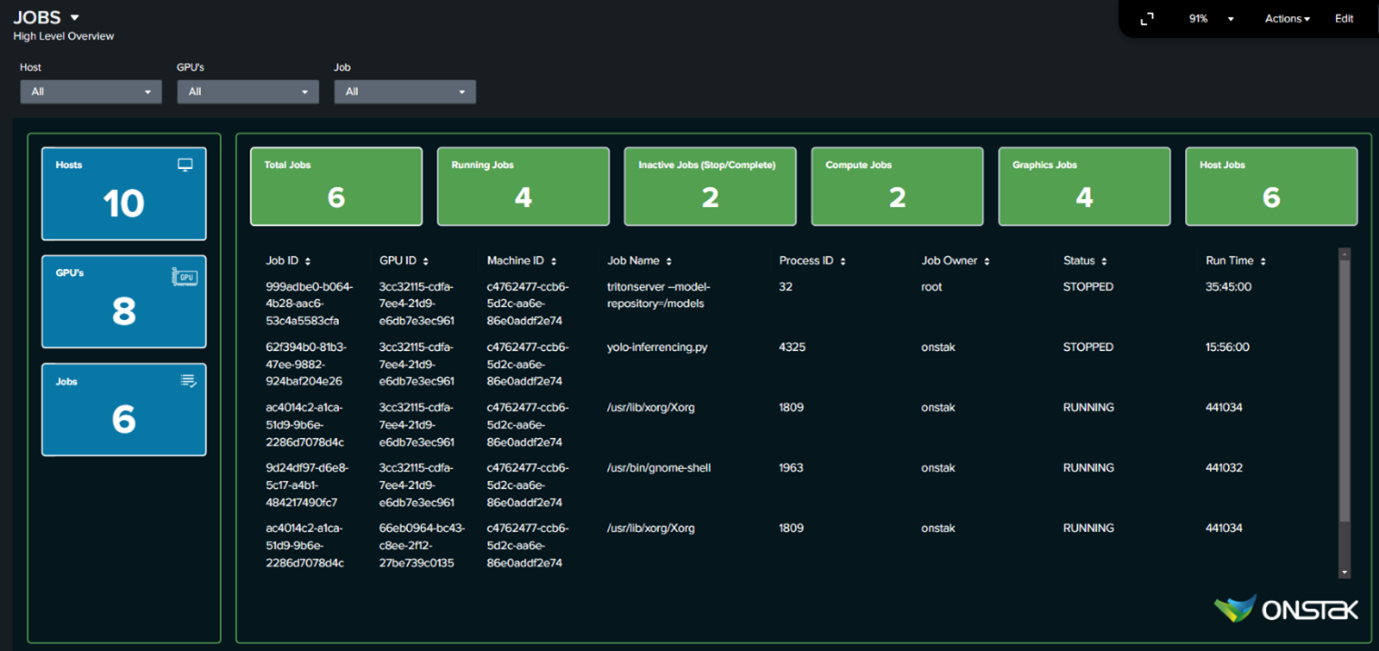
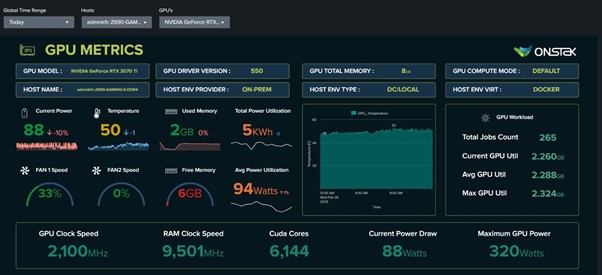
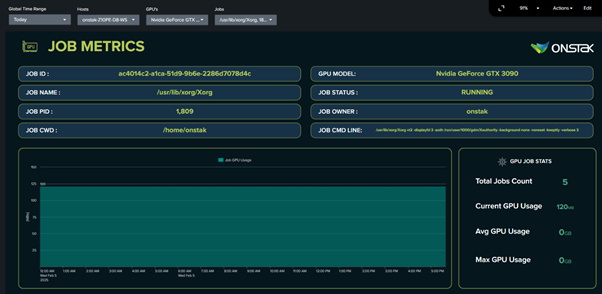
4.6.3 High-Level Overview of Key Dashboards
The GPU Analytics app offers a wide range of dashboards, each providing important insights into different aspects of your GPUs. Below are a few examples of the dashboards:
Overall Machines Dashboard
Overall GPUs Dashboard
Overall GPU Jobs Dashboard
GPUs Drill-Down Dashboard
Jobs Drill-Down Dashboard
5. Summary / Conclusion
“In summary, the gpu-mon-cli application provides real-time GPU performance monitoring and seamlessly integrates with Splunk for data visualization and analysis. Ensuring its continuous operation allows for accurate tracking and efficient system performance management."
6. Instructions
"To get started, execute the command sudo ./run on a GPU-enabled machine. For configuration assistance, refer to the setup guide or contact support."
7. Contact Information
“We understand that every organization has unique requirements. Our team is equipped to develop custom solutions tailored to your specific needs, whether it's advanced analytics, additional integrations, or specialized monitoring capabilities.”
“For further inquiries or technical support, please reach out to info@onstak.com or visit https://onstak.com“
8. Closing Statement
"Thank you for using gpu-mon-cli. We appreciate your feedback and look forward to helping you optimize your GPU."